AI lab, part 2: running an emulated GB200 cluster with Slurm
Table of Contents
Running the emulated GB200 cluster with Slurm: GPU scheduling, jobs from srun to PyTorch DDP, drains, quotas and monitoring. Part 1 introduced the lab: one NVL8 NVLink domain with two trays of four fake GB200 GPUs, running on a single Linux machine. This post covers the default scheduler, Slurm 23.11. We’ll read the cluster’s state, look at how it’s configured for GPUs, run jobs from a one-liner up to PyTorch DDP across both trays, do some routine operations, and watch all of it in Prometheus. Commands prefixed with There is one partition with two nodes. Each node has four GPUs of type Accounting is enforced, so a user without an association can’t submit anything. The configuration is short. These are the lines that matter for GPUs, from Binding. Ask for 8 tasks with one GPU each and check what every task receives: What CUDA sees. A job that asks for two GPUs sees two GPUs: A batch job across the domain. The examples from the repository ( All eight GPUs are in clique PyTorch DDP on 8 GPUs. The step time comes from the simulated cost of the GEMMs and the all-reduce. Change Accounting. Every job is recorded with its GPU allocation: Draining a node for maintenance. Run these as root on the controller ( A job that needs both trays now waits, and Slurm says why: GPU quotas. Limits live on associations. Cap The 8-GPU job waits on While the 60,000-step DDP job runs, the tray looks busy: Compare that with the idle numbers from Part 1 (about 140 W, 32 °C, 0 %). Prometheus ( In Grafana ( Scheduler & NVLink fabric shows allocated versus total GPUs, GPUs per user and jobs by state. Here Draining a node or submitting a job that can’t run shows up there too, which makes the lab a convenient sandbox for building alerts. Part 6 walks through both dashboards panel by panel. Part 3: Kubernetes rebuilds the same hardware with k3s, Kueue and JobSet, and runs the same four jobs as pods.$ run on the login node as the directory user joe (bin/ssh login). Commands that start with bin/ run from the repository root on the host.Runtime information
$ sinfo
PARTITION AVAIL  TIMELIMIT  NODES  STATE NODELIST
gpu*         up   infinite      2   idle sched-worker[1-2]

$ sinfo -N -o "%N %G %c %m %d %T"
NODELIST GRES CPUS MEMORY TMP_DISK STATE
sched-worker1 gpu:gb200:4 4 7500 51200 idle
sched-worker2 gpu:gb200:4 4 7500 51200 idlegb200, 4 cores, 7.5 GB of schedulable memory and 50 GB of node-local scratch. scontrol show node gives the full picture, including what’s allocated right now:$ scontrol show node sched-worker1
NodeName=sched-worker1 Arch=x86_64 CoresPerSocket=4
…
Gres=gpu:gb200:4
RealMemory=7500 AllocMem=0 FreeMem=9109 Sockets=1 Boards=1
State=IDLE ThreadsPerCore=1 TmpDisk=51200 Weight=1 Owner=N/A MCS_label=N/A
Partitions=gpu
CfgTRES=cpu=4,mem=7500M,billing=4,gres/gpu=4
AllocTRES=joe belongs to the account lab:$ sacctmgr -n show assoc user=joe format=cluster,account,user,qos
nvl8 lab joe normalHow it’s configured
/etc/slurm/slurm.conf on sched-control:SelectType=select/cons_tres
SelectTypeParameters=CR_Core_Memory
DefMemPerCPU=1875
GresTypes=gpu
TopologyPlugin=topology/block
TmpFS=/scratch
AccountingStorageEnforce=associations,limits,qos
AccountingStorageTRES=gres/gpu
ProctrackType=proctrack/linuxproc
TaskPlugin=task/none
NodeName=sched-worker1,sched-worker2 … RealMemory=7500 TmpDisk=51200 Gres=gpu:gb200:4cons_tres schedules CPUs, memory and GPUs as separate trackable resources, so two jobs can share a tray.gres.conf maps each GPU to its device node and tells Slurm that every pair is connected by 18 NVLinks, matching what nvidia-smi topo -m reports:NodeName=sched-worker1,sched-worker2 Name=gpu Type=gb200 File=/dev/nvidia0 Links=-1,18,18,18
…topology/block is the setting that matters for NVL-class systems. A block is a set of nodes that share an NVLink partition, and Slurm keeps jobs that fit in one block inside it. Nobody writes topology.conf by hand here. NVIDIA’s topograph generates it every minute from the live fabric (more on that in Part 5):$ scontrol show topology
BlockName=block001 BlockIndex=0 Nodes=sched-worker[1-2]AccountingStorageTRES=gres/gpu records GPU usage per job, user and account.proctrack/linuxproc and task/none have a lab-specific reason: the trays are unprivileged containers, so Slurm has no cgroups to confine jobs. GPU isolation therefore comes from CUDA_VISIBLE_DEVICES, which the fake CUDA driver honours.Simple jobs
$ srun -N2 --ntasks-per-node=4 --gpus-per-task=1 bash -c 'echo $(hostname) $CUDA_VISIBLE_DEVICES' | sort
sched-worker1 0
sched-worker1 1
sched-worker1 2
sched-worker1 3
sched-worker2 0
sched-worker2 1
sched-worker2 2
sched-worker2 3$ srun -N1 --gpus-per-node=2 bash -c 'echo CVD=$CUDA_VISIBLE_DEVICES;
/shared/venv/bin/python -c "import torch; print(torch.cuda.device_count())"'
CVD=0,1
2nvidia-smi inside the same job still lists all four GPUs on the tray. Real nvidia-smi ignores CUDA_VISIBLE_DEVICES too, and without cgroup device confinement nothing hides the other device nodes. Keep that in mind if you write tooling that counts GPUs.bin/scp -r examples login:) include nvl8-hello.sbatch, which runs eight tasks with one GPU each. Every task reports its GPU’s UUID and NVLink clique:$ cd examples/slurm && sbatch --wait nvl8-hello.sbatch
Submitted batch job 14
$ cat nvl8-hello-14.out
job 14 on sched-worker[1-2]: 8 tasks
0: rank 0 on sched-worker1 CUDA_VISIBLE_DEVICES=0: NVIDIA GB200, GPU-81501924-f170-f6d0-f2da-dc7595876881, 1, scratch 198G
1: rank 1 on sched-worker1 CUDA_VISIBLE_DEVICES=1: NVIDIA GB200, GPU-8150a4ae-478e-5534-f66c-621a95f85f59, 1, scratch 198G
…
7: rank 7 on sched-worker2 CUDA_VISIBLE_DEVICES=3: NVIDIA GB200, GPU-814804a5-291e-ba91-a4e9-01fb69ea739b, 1, scratch 198G1, which is the same NVLink partition.ddp-train.sbatch starts one torchrun per tray, with four ranks each, NCCL as the backend and rendezvous on the first node. It needs the frameworks venv (make frameworks), and extra arguments go straight to the training script:$ sbatch ddp-train.sbatch --steps 60000
Submitted batch job 2
$ grep -E "^step +(10|50|60000) |rank 0/" ddp-train-2.out
step 10 4.2 ms 120783 samples/s 49 TFLOP/s/GPU
step 50 4.4 ms 115140 samples/s 46 TFLOP/s/GPU
step 60000 4.4 ms 115881 samples/s 47 TFLOP/s/GPU
rank 0/8 on sched-worker1 cuda:0 (NVIDIA GB200) peak mem 7.1 GiB--width or --batch and it moves roughly the way it would on real hardware. The loss values are meaningless, since nothing is computed.Operations
$ sacct -X -o JobID,JobName,User,Account,AllocTRES%45,Elapsed,State
2             ddp-train       joe        lab  billing=8,cpu=8,gres/gpu=8,mem=15000M,node=2   00:04:41  COMPLETED
3 nvl8-hello joe lab billing=8,cpu=8,gres/gpu=8,mem=15000M,node=2 00:00:01 COMPLETEDbin/ssh sched-control):# scontrol update nodename=sched-worker2 state=drain reason="maintenance: BMC firmware"
# sinfo -R
REASON USER TIMESTAMP NODELIST
maintenance: BMC fir root 2026-10-05T19:31:07 sched-worker2$ sbatch -J two-trays -N2 --gpus-per-node=4 --wrap "nvidia-smi -L"
$ squeue
JOBID PARTITION NAME USER ST TIME NODES NODELIST(REASON)
17 gpu two-tray joe PD 0:00 2 (Nodes required for job are DOWN, DRAINED or reserved for jobs in higher priority partitions)scontrol update nodename=sched-worker2 state=resume brings the node back, and job 17 runs within seconds. In Part 4 we power-cycle a tray through its BMC, which is the other half of this runbook.joe at four GPUs:# sacctmgr -i modify user joe set GrpTRES=gres/gpu=4
$ sbatch -J big -N2 --gpus-per-node=4 --wrap "sleep 5"
$ sbatch -J small -N1 --gpus-per-node=4 --wrap "sleep 5"
$ squeue -o "%.5i %.8j %.2t %.20R"
JOBID NAME ST NODELIST(REASON)
18 big PD (AssocGrpGRES)
19 small R sched-worker1AssocGrpGRES while the 4-GPU job runs. GrpTRES=gres/gpu=-1 removes the limit again. This is a cheap place to test a quota tool or a fair-share policy before you try it on a cluster people depend on.Monitoring
$ bin/ssh sched-worker1 nvidia-smi --query-gpu=index,utilization.gpu,memory.used,power.draw,temperature.gpu --format=csv
index, utilization.gpu [%], memory.used [MiB], power.draw [W], temperature.gpu
0, 79 %, 7850 MiB, 813.26 W, 67
1, 81 %, 7850 MiB, 850.17 W, 68
…
$ bin/ssh sched-worker1 nvidia-smi --query-compute-apps=pid,process_name,used_memory --format=csv
pid, process_name, used_memory [MiB]
10404, /shared/venv/bin/python, 7338 MiB
…http://10.107.111.10:9090) scrapes the same values through the GPU exporter, and it also scrapes the Slurm exporter and a small GPU-allocation collector. Recording rules turn these into scheduler-neutral sched_* series, which the dashboards are built on. With the DDP job running and nvl8-hello (job 3) waiting behind it:Query Value during the job sched_gpus_alloc8sched_user_gpus{user="joe"} 8sched_jobsRUNNING 1, PENDING 1sum by (instance) (nvidia_smi_utilization_gpu_ratio)3.32 and 3.38 per tray (4 GPUs × ~80 %)sum(rate(nvlink_gpu_tx_bytes_total[1m]))~3.4 TB/s of all-reduce traffic over NVLink http://10.107.111.10:3000), Lab overview shows the per-GPU curves. In this run, all eight GPUs move together: utilisation jumps to 80–85 %, power to 810–870 W per GPU (about 7 kW for the domain), temperature climbs to 67–68 °C over a minute, and memory and processes appear as the job starts and disappear when it ends: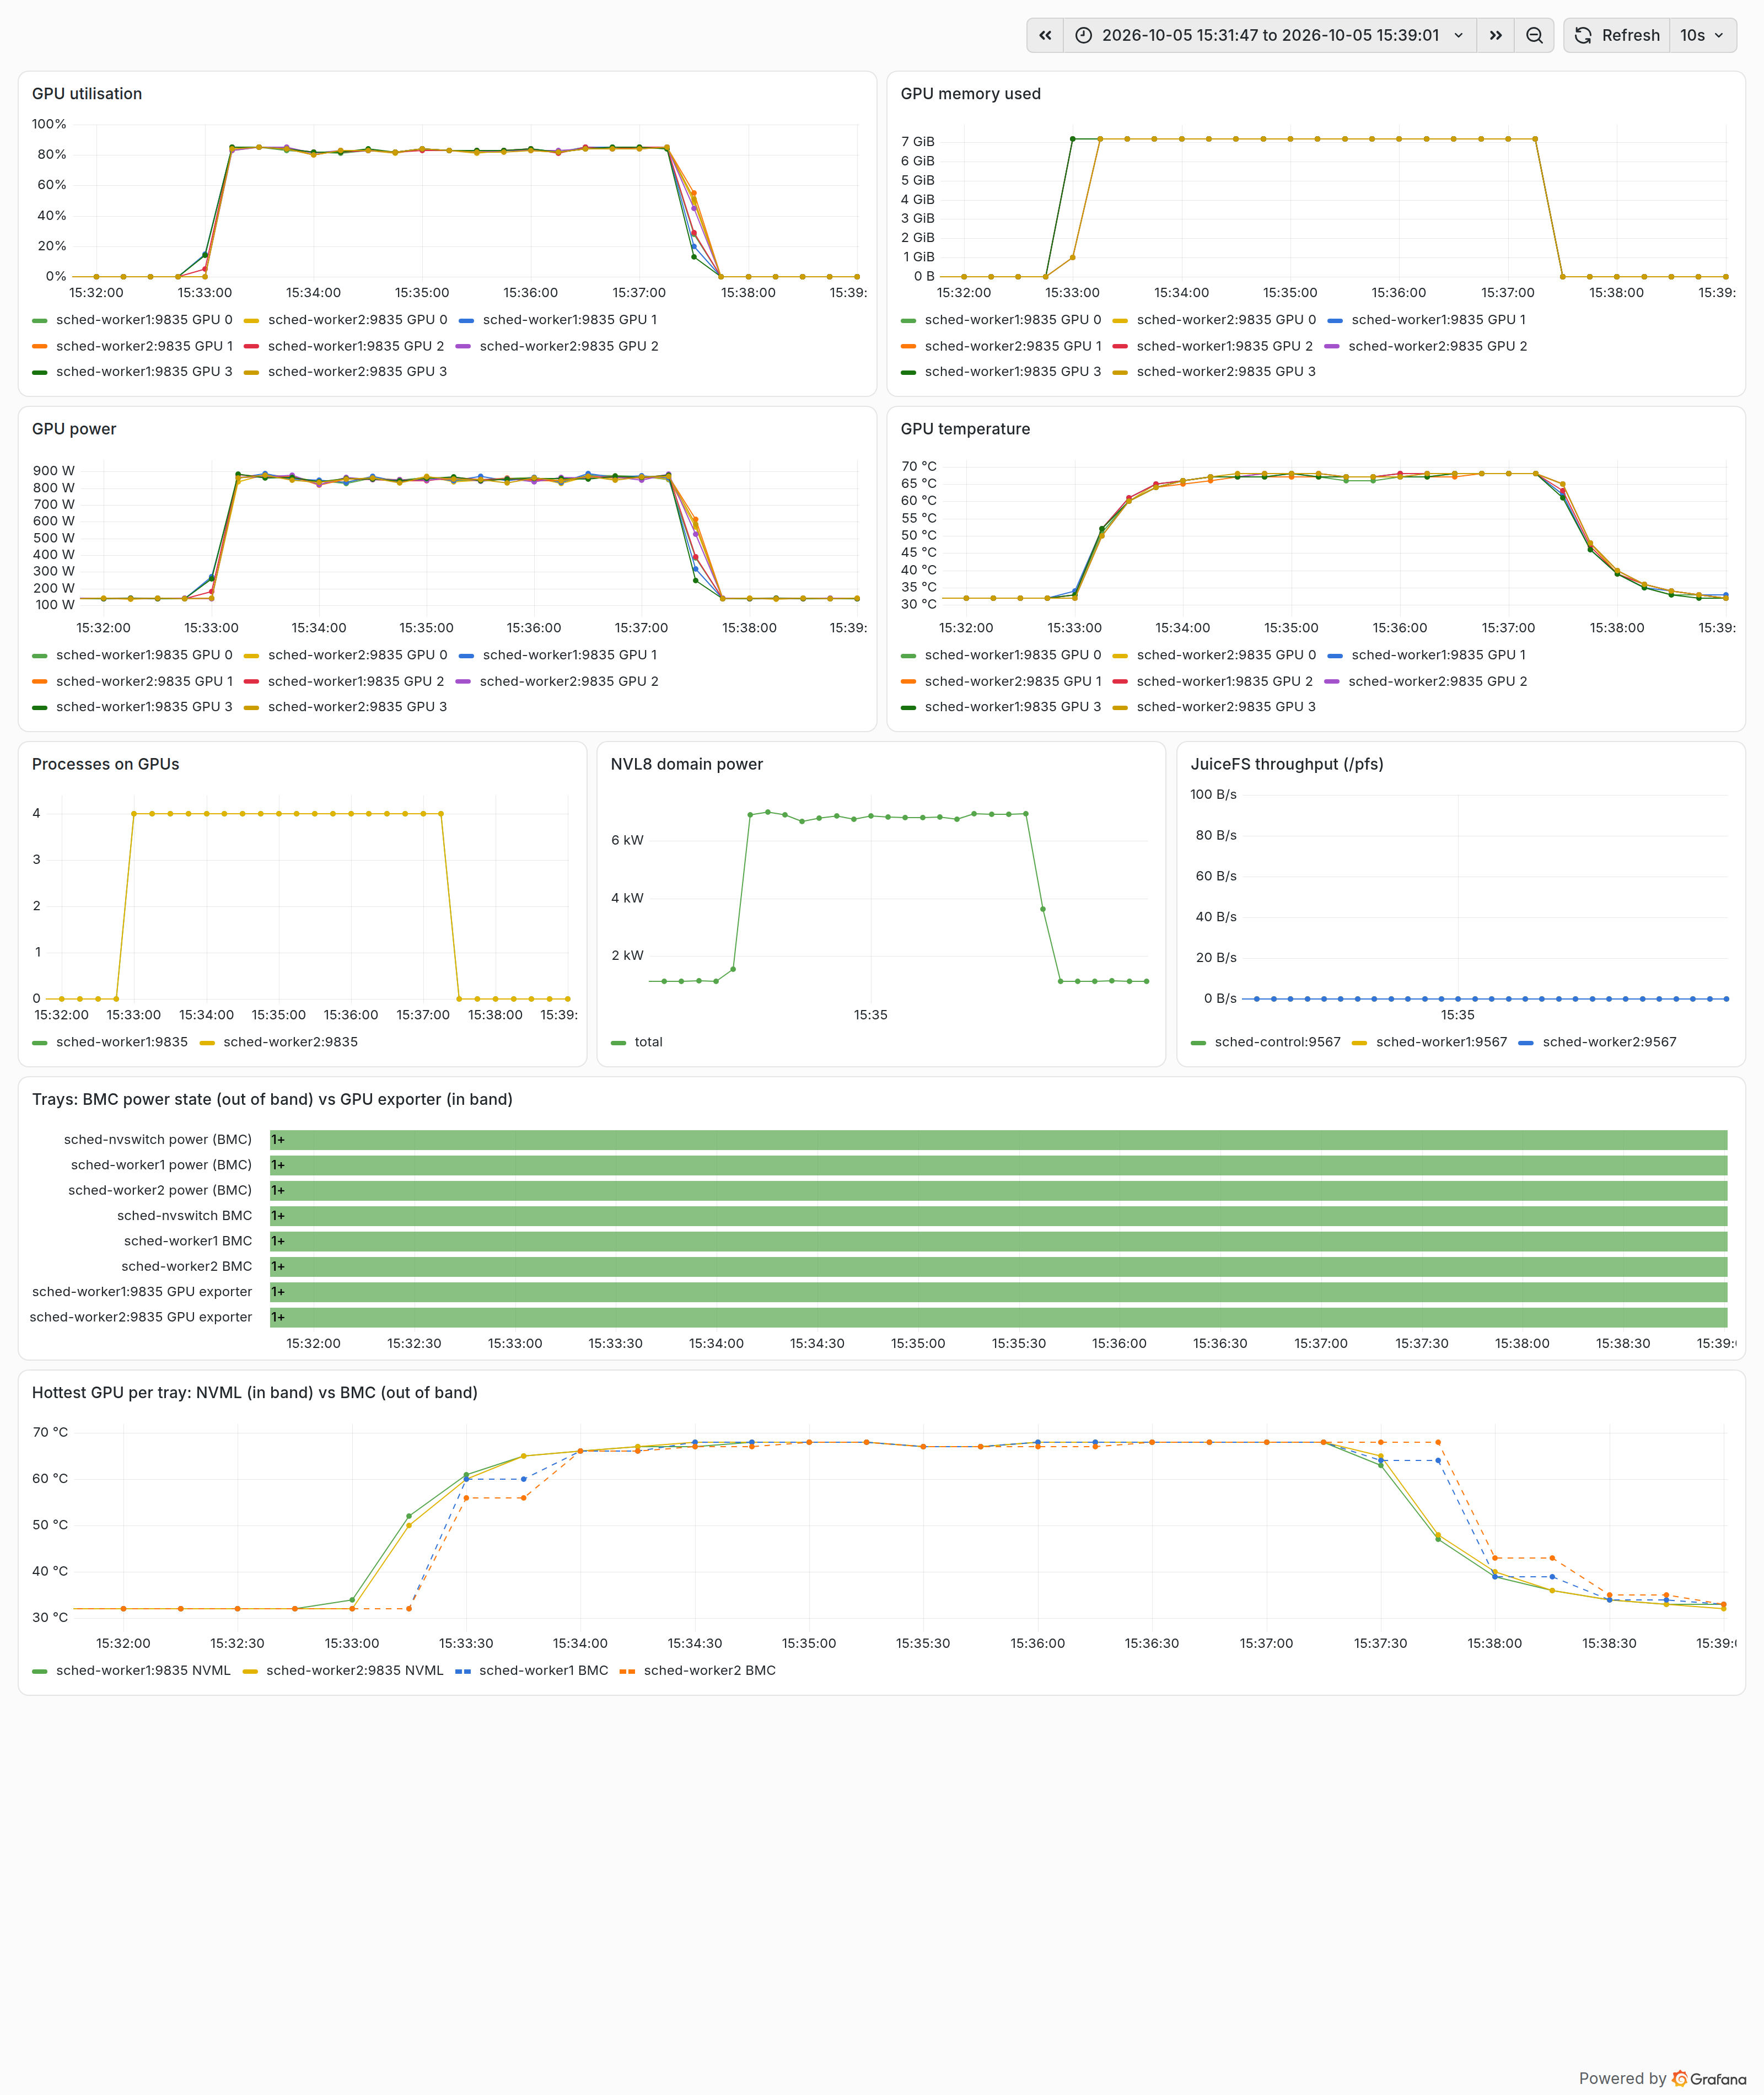
nvl8-hello waits as pending (yellow) under the running DDP job (blue) until the GPUs free up: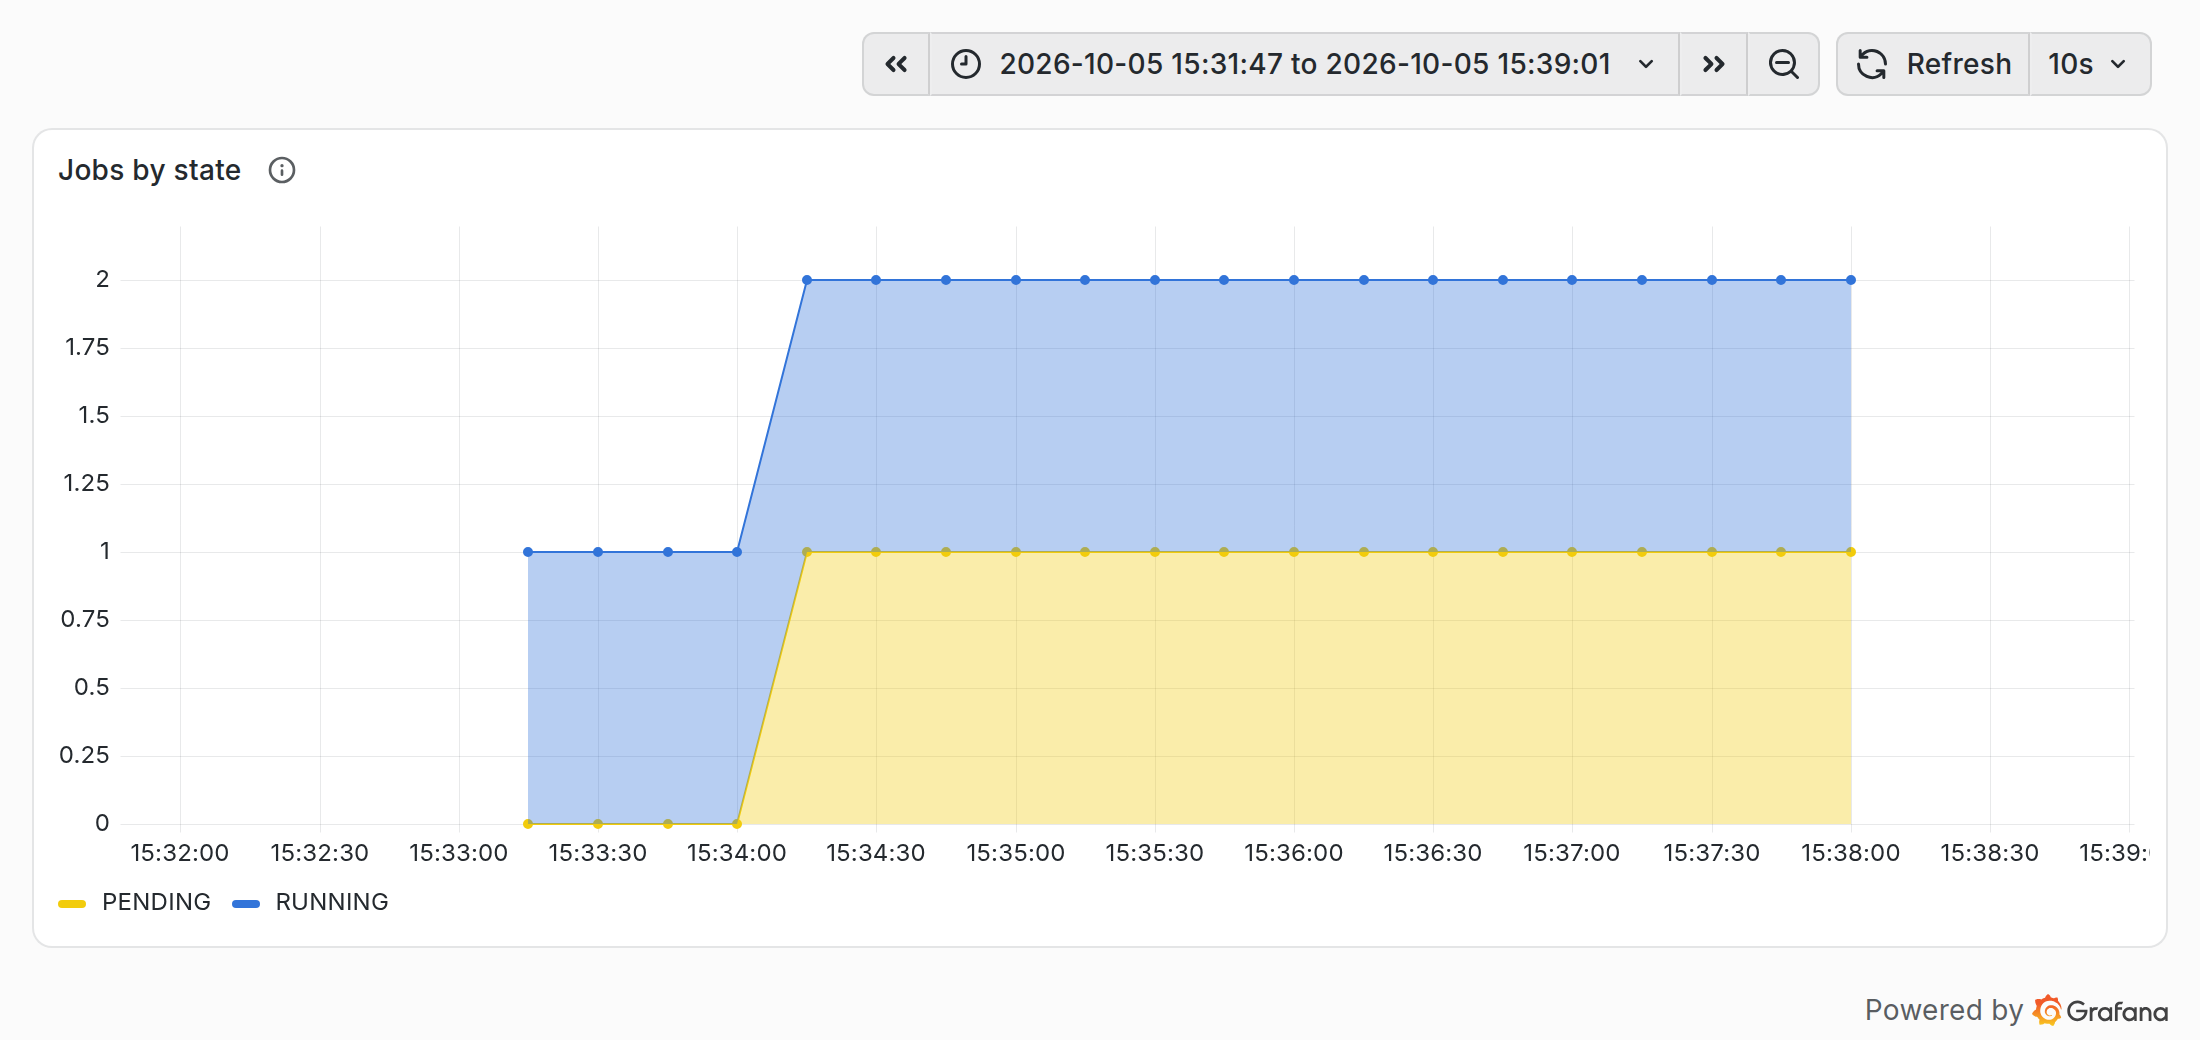
Next in the series